Radio Reporting Software for Broadcasters
Know exactly who is listening to your station with our new radio reporting software.

As a broadcaster you need to know who is tuning into your station at a glance. That's why at Radio.co we have launched brand new radio reporting software with new statistics aimed at vastly improving the functionality and quality of data you are able to see about your listeners.
What's Changed?
The biggest difference you'll notice is how data is handled and displayed. For example, here is a comparison from a station we run, Birdsong FM, showing the month of April in each system.
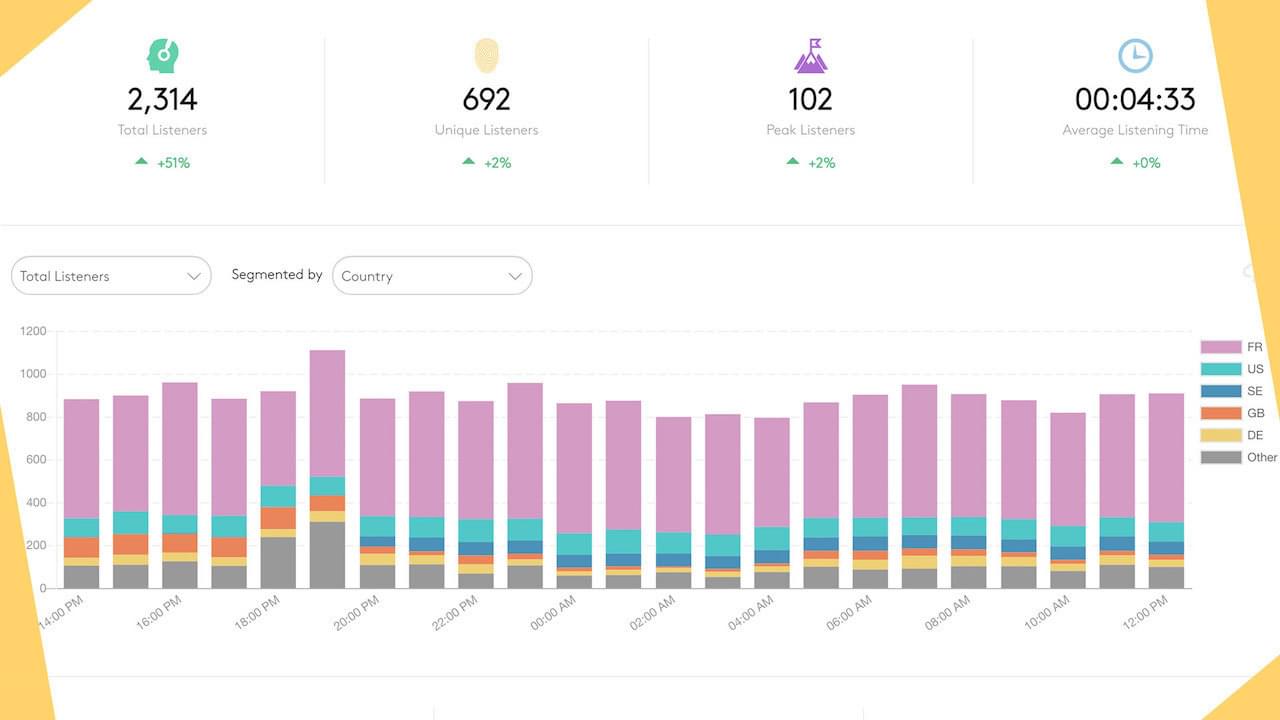
How it Used to Look (OLD)

How it Looks Now (NEW)

There's quite a difference in how they look and the actual figures themselves. The old reports show a large portion of Total Listeners which are coming from France using a "Java" platform, whereas this isn't shown at all in the new graph - this is because they are spamming the stream. Our new system intelligently filters out any spam connections and connections from non-humans. As a result, this is not an accurate representation of your listeners.
This is just one example of how the new radio reporting software will benefit your station. For a more in-depth look at what's been changed, check out the help guide below.
Overview: Reporting Dashboard
Accurately measure your listenership and use the powerful filtering options to gain deeper insights into your listeners.
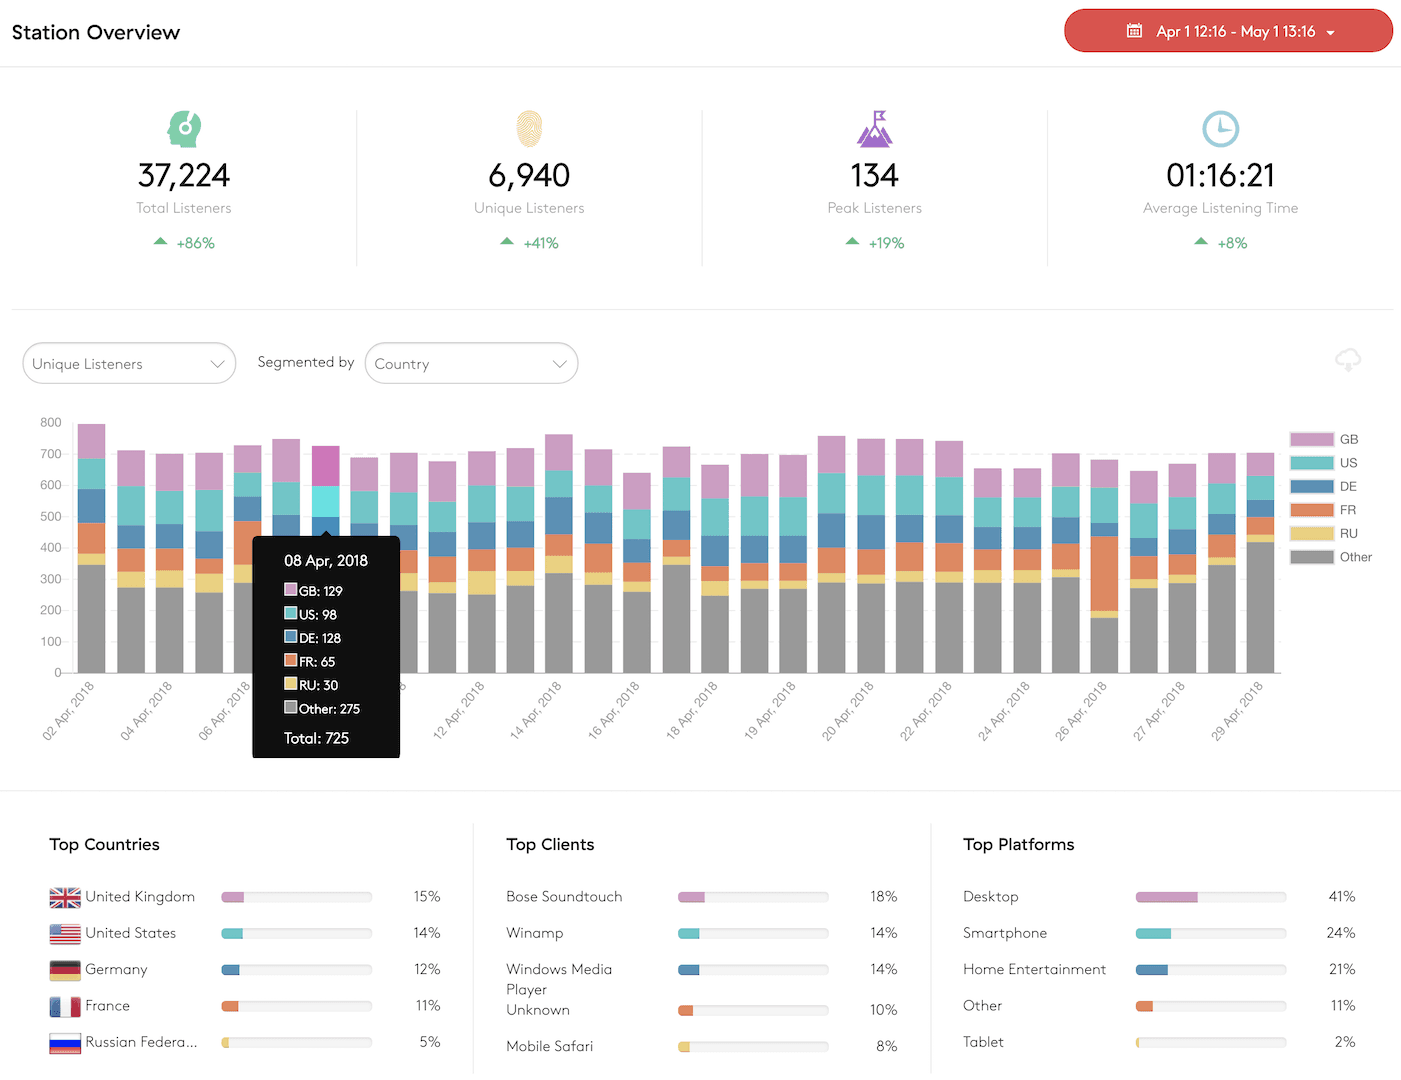
The new reporting software now lets you do the following:
- Set the time period to a pre-set time frame (e.g. last 30 days) or choose a specific time period.
- At a glance view metrics showing total listeners, unique listeners, peak listeners, and average listening time for the set time period.
- In the graph, change the listenership chart to total listeners, unique listeners, average listening time and peak listeners.
- Segment total and unique listeners by country, platform (type of device), and client (device used).
- Use the filtering options on the right-hand side to specify what data you want to see.
- Export the graph data using the cloud button in the top right corner.
- At the bottom, see the top 5 Countries, Clients and Platforms.
Real Time: Current Connections
At a glance, discover who is listening to your radio station with every single concurrent connection.
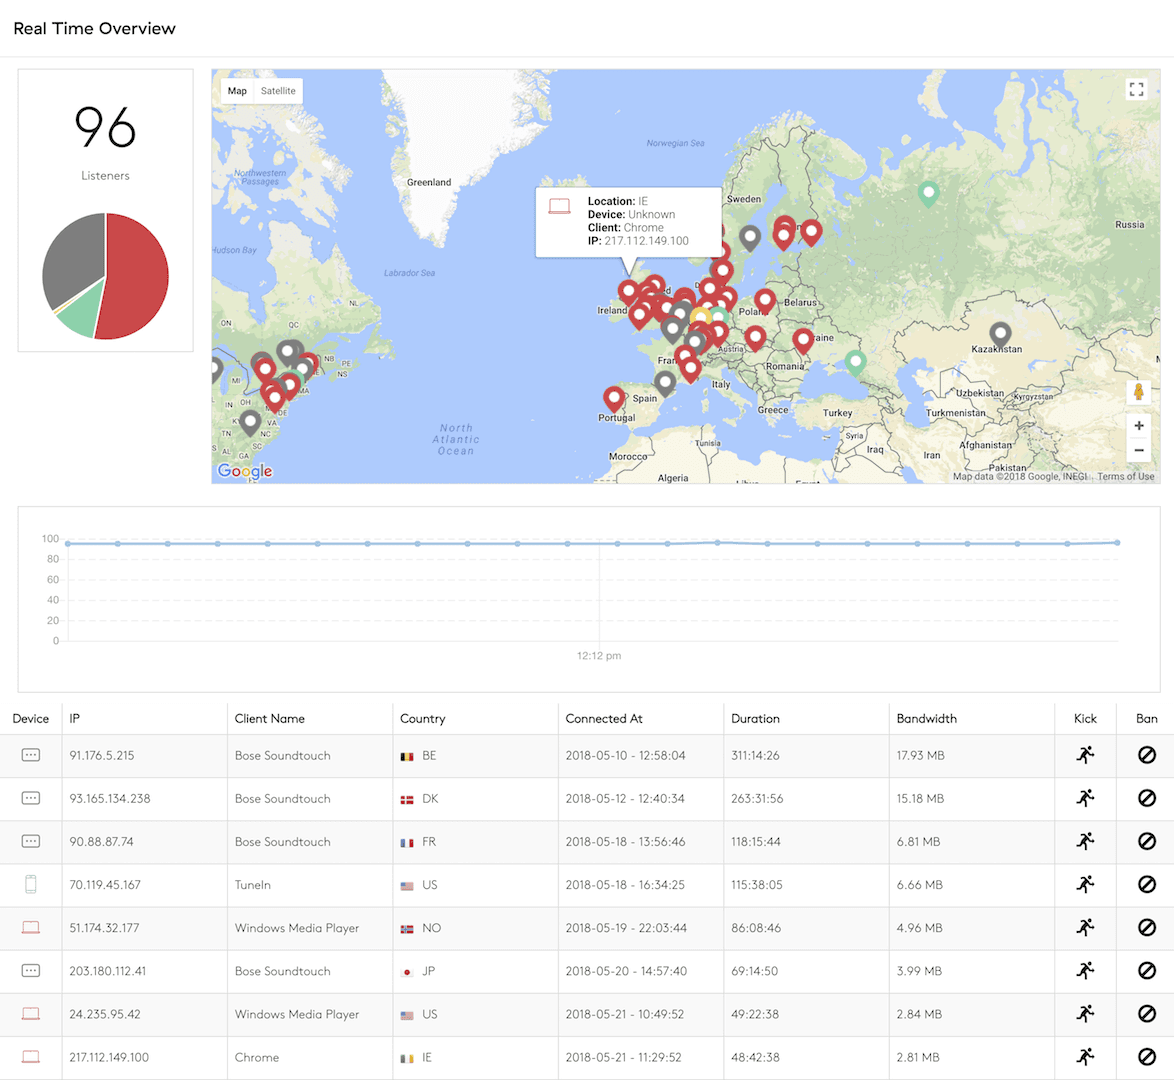
- View a map of your current listeners.
- What devices are being used, shown by the pie chart and individually in the list or on the map.
- A graph of listenership over time while you're watching.
- Kick or Ban listeners.
Analytics Reports: Historical Stats
Track listenership metrics over time to see how your station is performing, either by the last hour, 24 hours, 7 days, 30 days, or a specific time period.
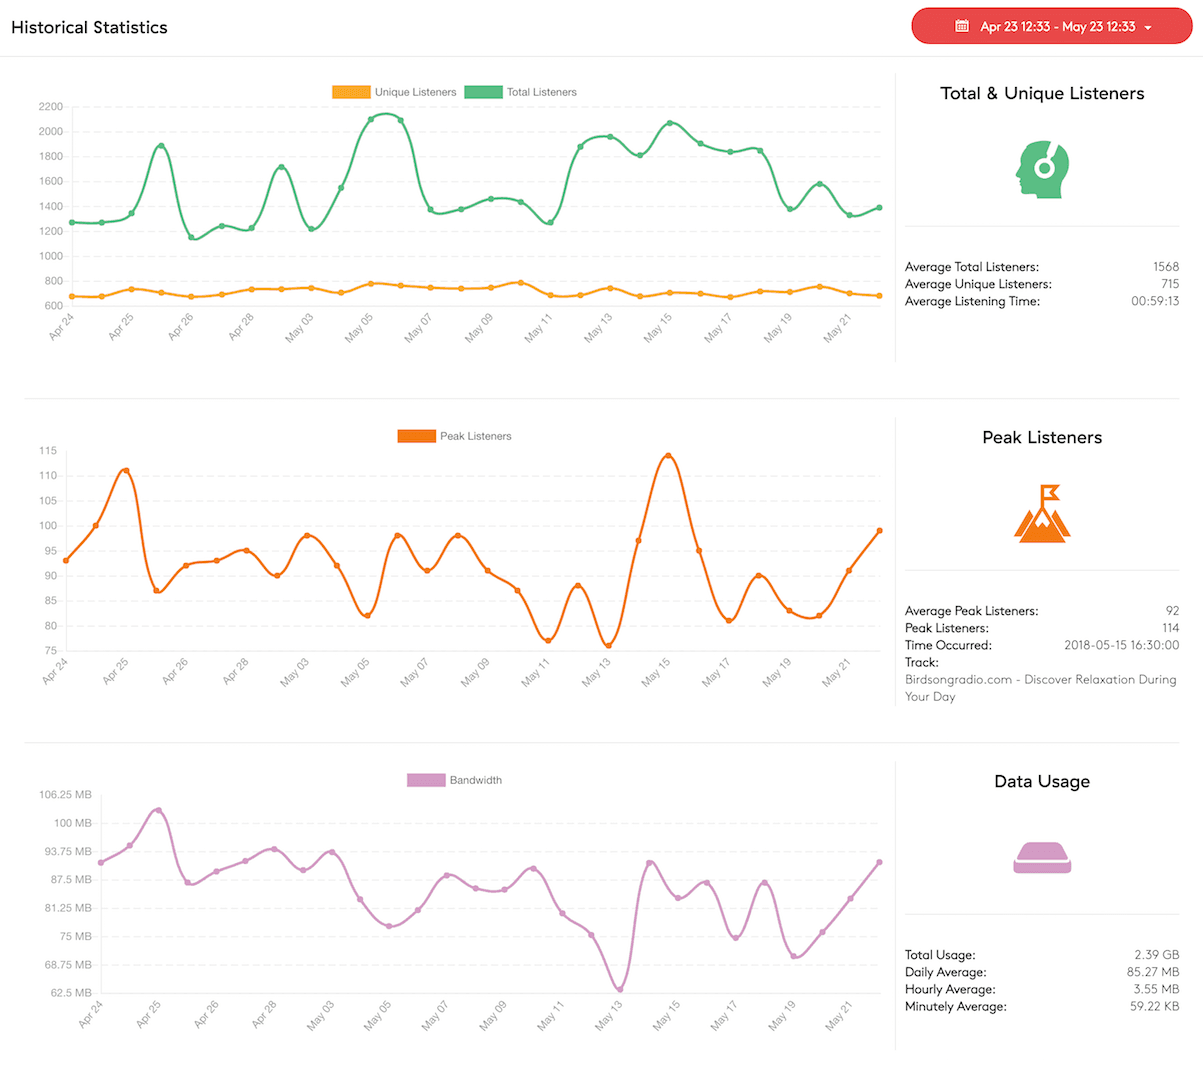
- Set the time period to a pre-set time frame (e.g. last 30 days) or choose a specific time period.
- In the first graph, track unique and total listeners. Hover over each point on the graph or see the average total and unique listeners or the average listening time. Filter the graph using the orange and green buttons above.
- In the second graph, see peak listenership. Find when your station was most popular on the right-hand side at the specific time and see which track was playing at the time.
- In the third graph, track your station's bandwidth usage and see averages for each time period on the right-hand side.
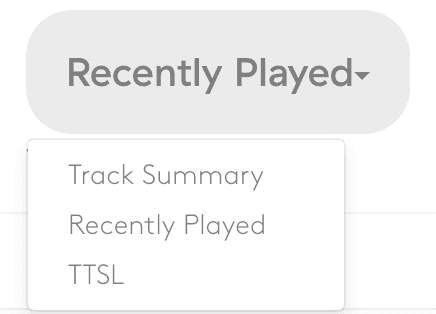
Playout Reports: Track Summary, Recently Played, & TTSL
View comprehensive playout reports for tracking your station's playout for reporting purposes. View your track summary, recently played, or TTSL by selecting them from the drop-down menu.
Track Summary

- Set the time period to a pre-set time frame (eg, Last 30 days), or choose a more specific time period.
- At the top, see at a glance metrics showing total tracks played, unique tracks played, the average tracks per Hhour, and the average duration of tracks.
- See a list of every track played on your station in the specified time period.
- The table shows duration, number of plays, listeners (at the time the track was played), and service plays.
- Service plays is also known as total performances and is calculated by number of plays multiplied by listeners.
- Export the data in the table using the "Download" button for reporting.
Recently Played
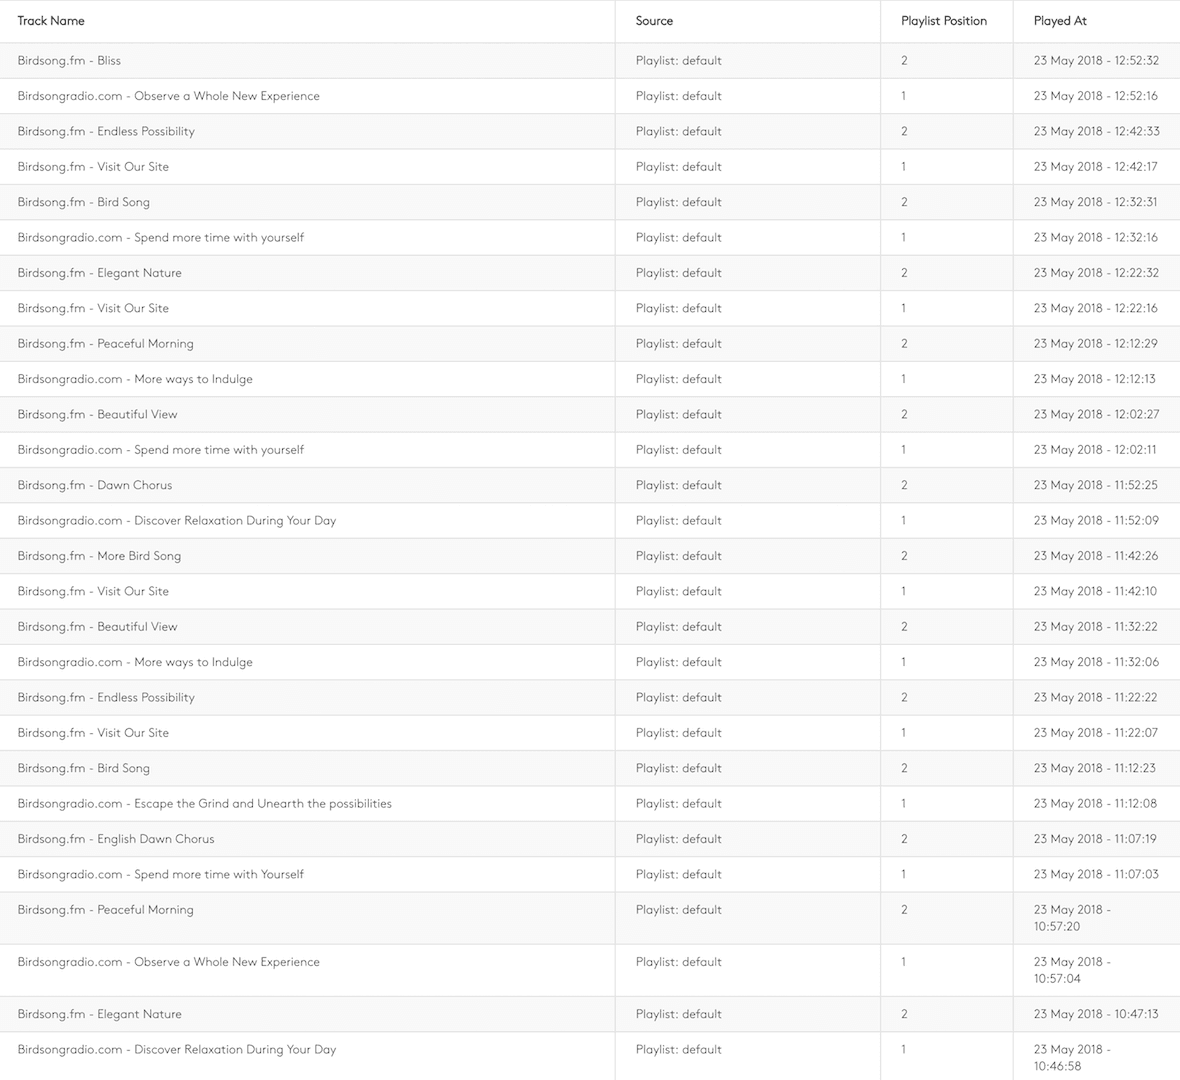
- View a list of tracks played within the last 24 hours.
- Export this data as a CSV
TTSL (Total Time Spent Listening)
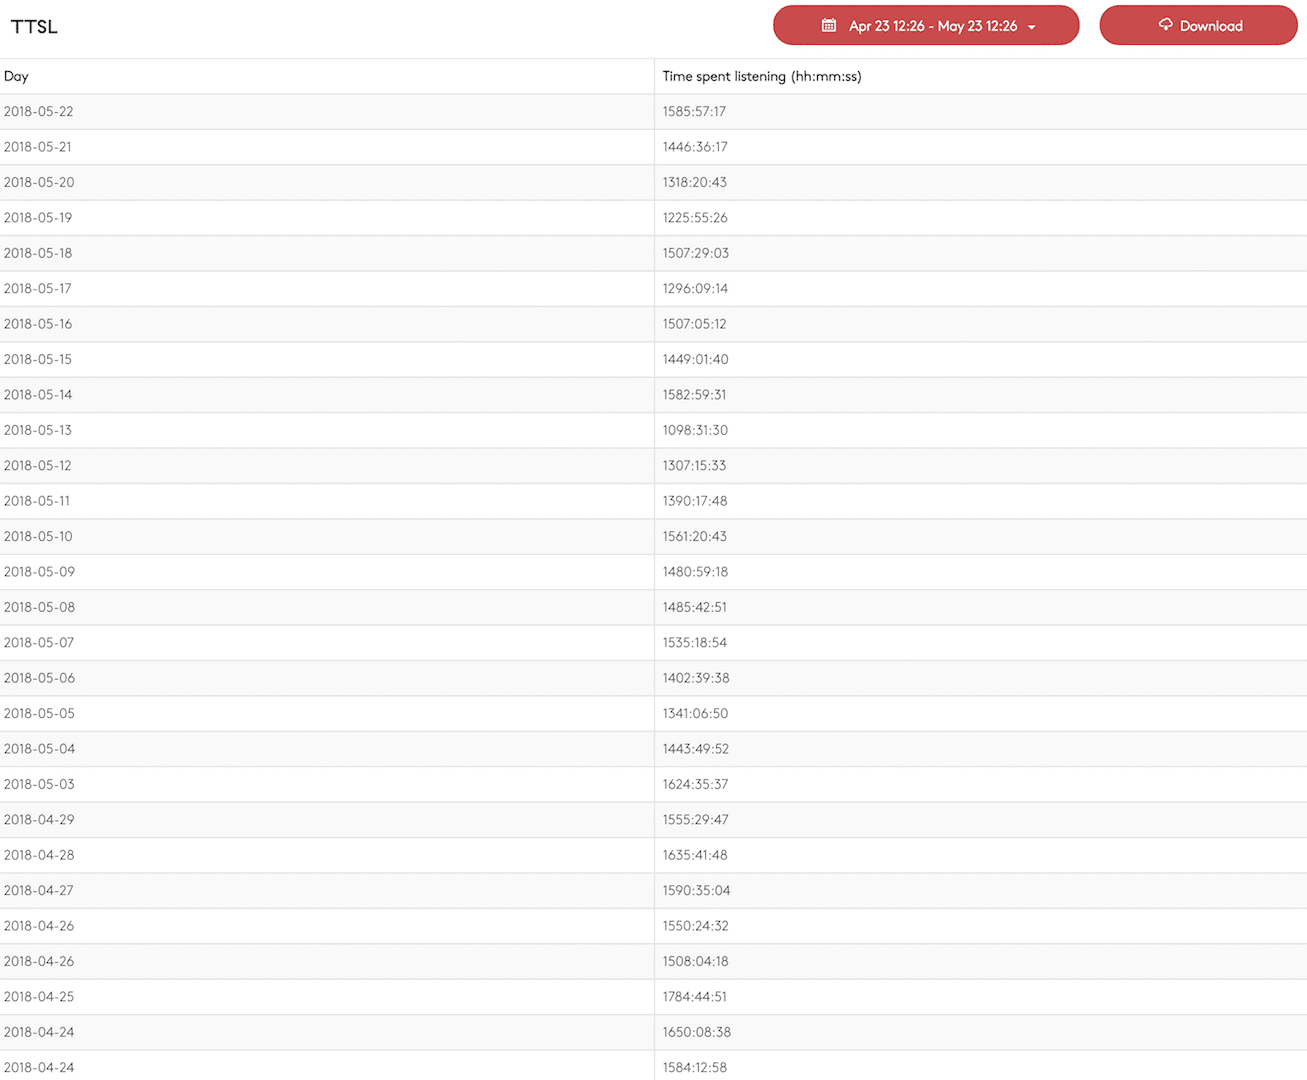
- Set the time period to a pre-set time frame (e.g. last 30 days) or choose a more specific time period.
- See a list of total listenership per day for the selected time period in hours, minute, and seconds.
- Export the data in the table using the "Download" button for reporting.
All-in-One Radio Reporting Software
Like what you see? 👀Why not take the new radio reporting software for a spin in your Dashboard. Alternatively, if you're not part of the Radio.co family yet then you can get started today with a 7 day free trial. Click the button below to get going or speak to one of the team by emailing studio@radio.co.